
Comidor gives you the opportunity to check the productivity of your business. Set up your corporate, team, or personal objectives and monitor them with KPIs. Indicators can be split into targets that divide the indicator’s period into smaller time windows allowing a higher degree of control and flexibility. You can define lower, optimal, and higher goals and assign them to rewards (measured in “Comidors”) and bonuses. A KPI can be connected with any type of Process, with a Template or Process Schedule.
Creating a KPI
Navigate to My Company icon > Business Architecture > KPIs.
- Click on the + icon to add a new KPI
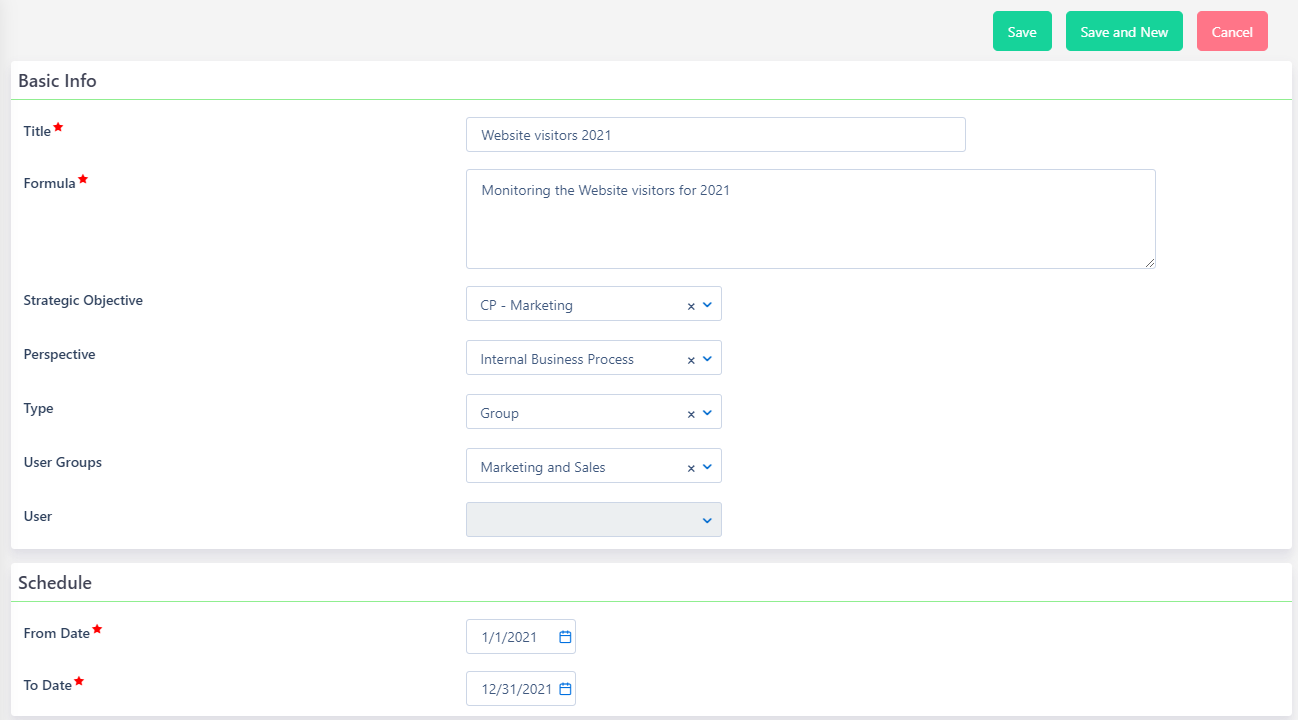
- Start with the Basic Info:
- Add the KPI Title and a description in the Formula field.
- Select the Strategic Objective (Example List could be: CP – Customer Profile, CP – Finance, CP – Lead Conversion, CP – Marketing, FP – Assets, FP – Employees, FP – Investment, FP – Products, FP – Sales, IBP – Efficiency, IBP – Finance, IBP – IT, IBP – Management, IBP – Quality, IBP – Sustainability, LG – Employees, LG – Finance, LF – Innovations, LG – IP)
- The Perspective (Internal Business Process, Learning, and Growth, Customer Perspective, Financial Perspective)
- Type (Corporate, Group, User)
- User Groups and/or User this KPI refers to
- Set up the Schedule (From Date – To Date) for this KPI
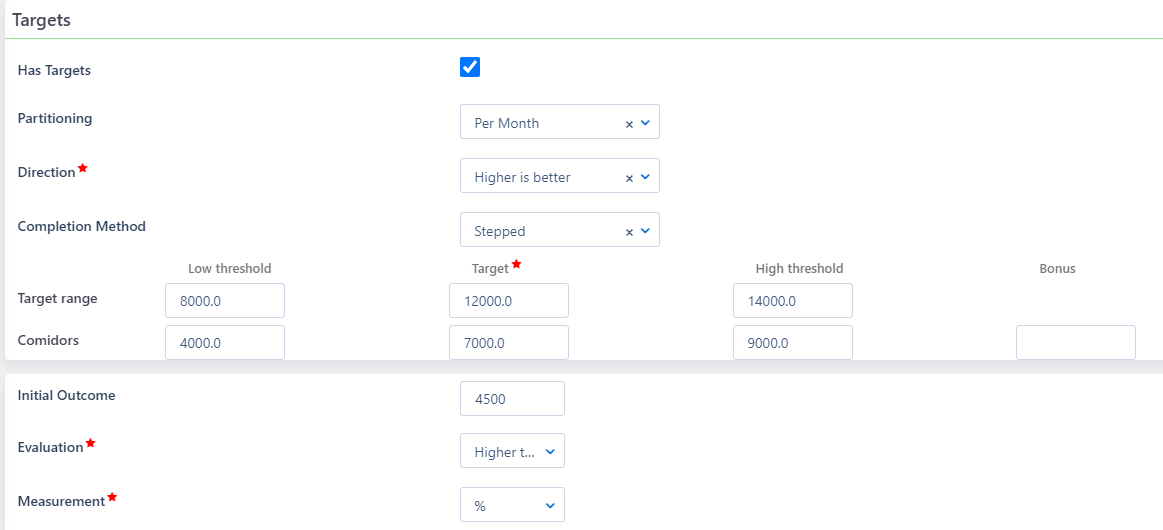
- Specify the Targets:
- Choose whether the KPI Has Targets
- Set up the Partitioning, if any (Per Day/Week/Fortnight/Month, Every Two/Three/Six months)
- Choose the Direction (Higher is better – e.g. for Sales oriented KPI, Lower is better – e.g. for Position in the Market KPI)
- The Completion Method can be Stepped (for KPIs where the target should be reached in each partition time frame) or Global (for KPIs where the target can be reached in total)
- Target Range needs at least a Target number, but a Low threshold and High threshold may comply. For each Target number, a number of “Comidors” can be gained. Bonus Comidors may be added, too.
- Initial Outcome – add the starting point for the target
- Evaluation method (Higher than, Lower than)
- Measurement units (Time, Money)
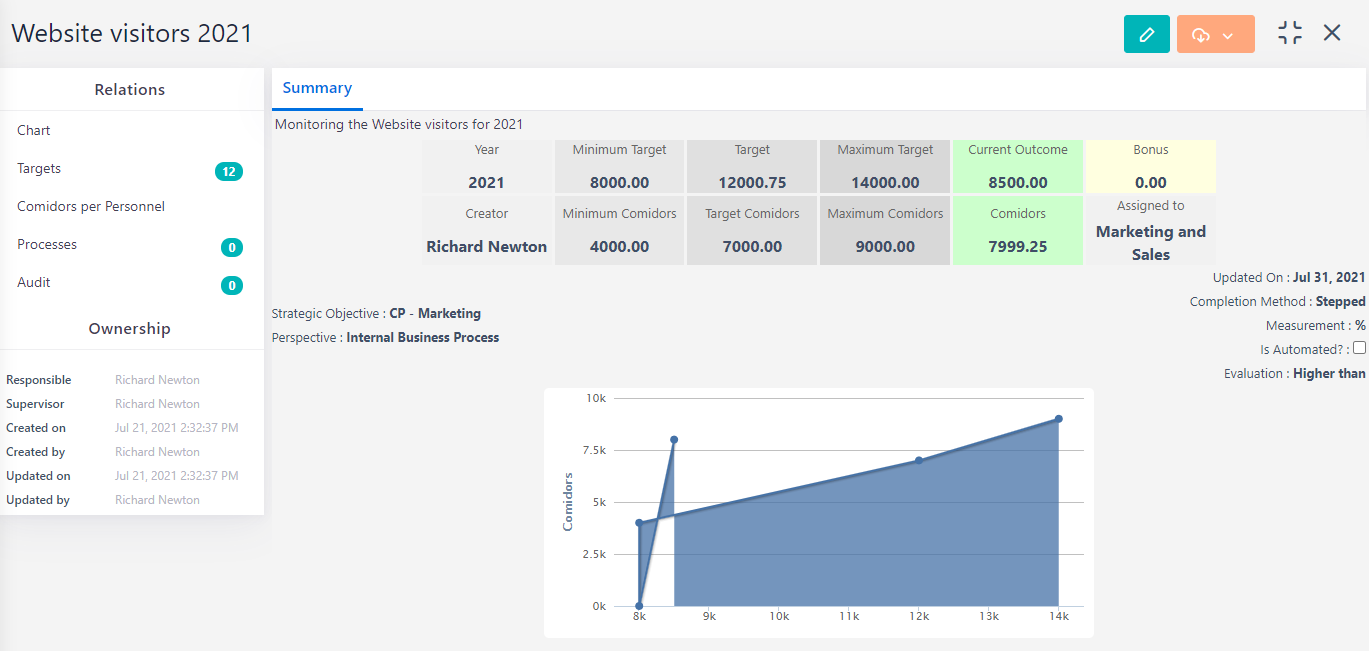
Navigating in a KPI
After entering a KPI a user can perform multiple actions:
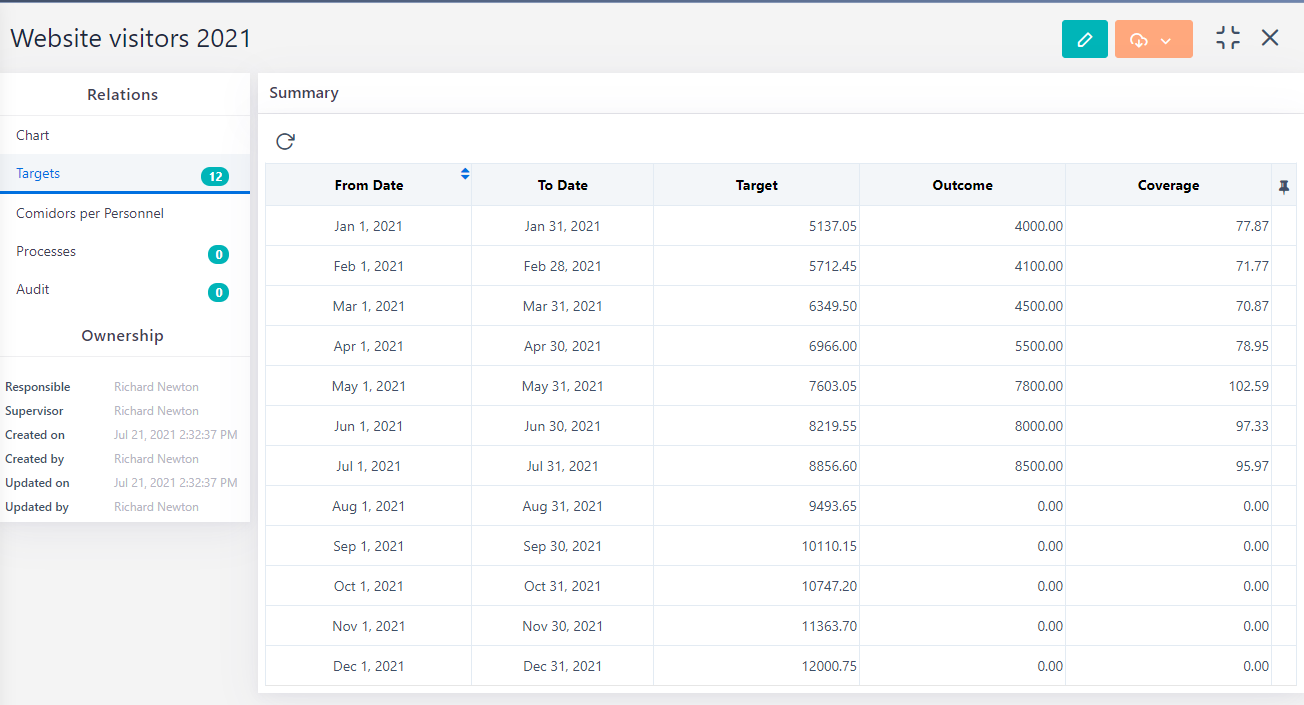
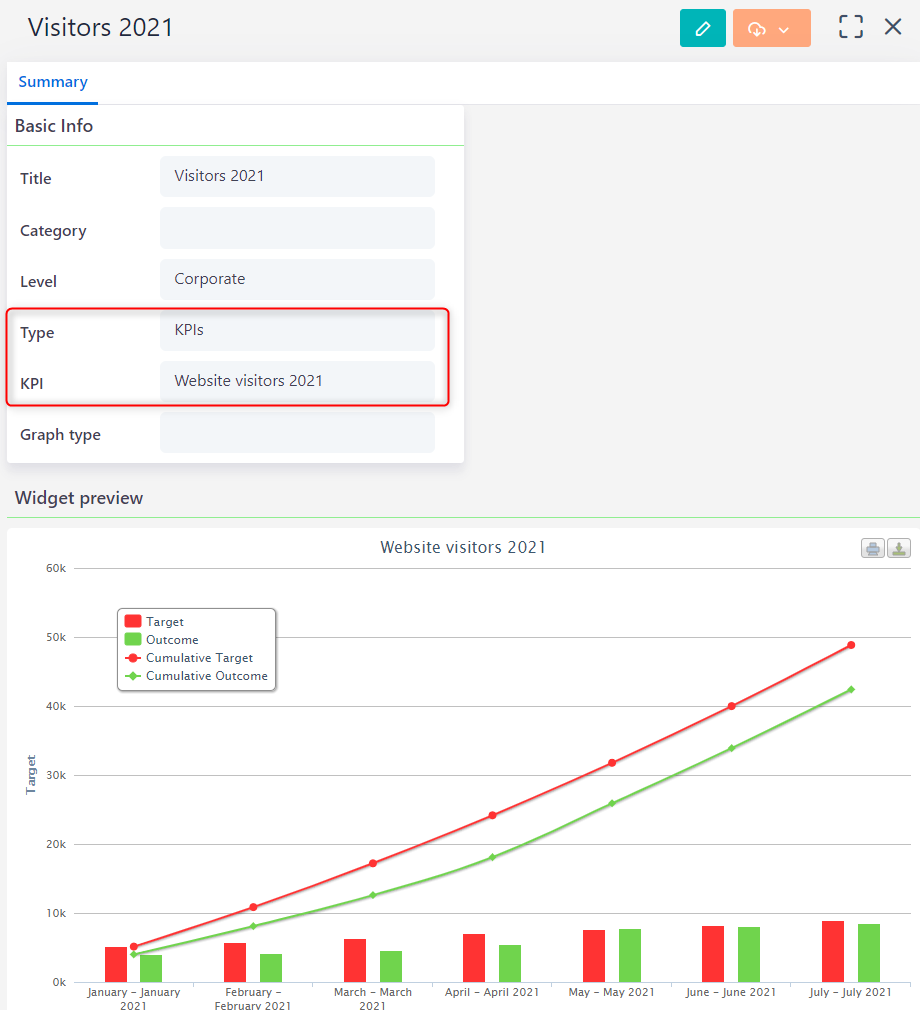
- Have a clear view of the KPI progress in the Summary
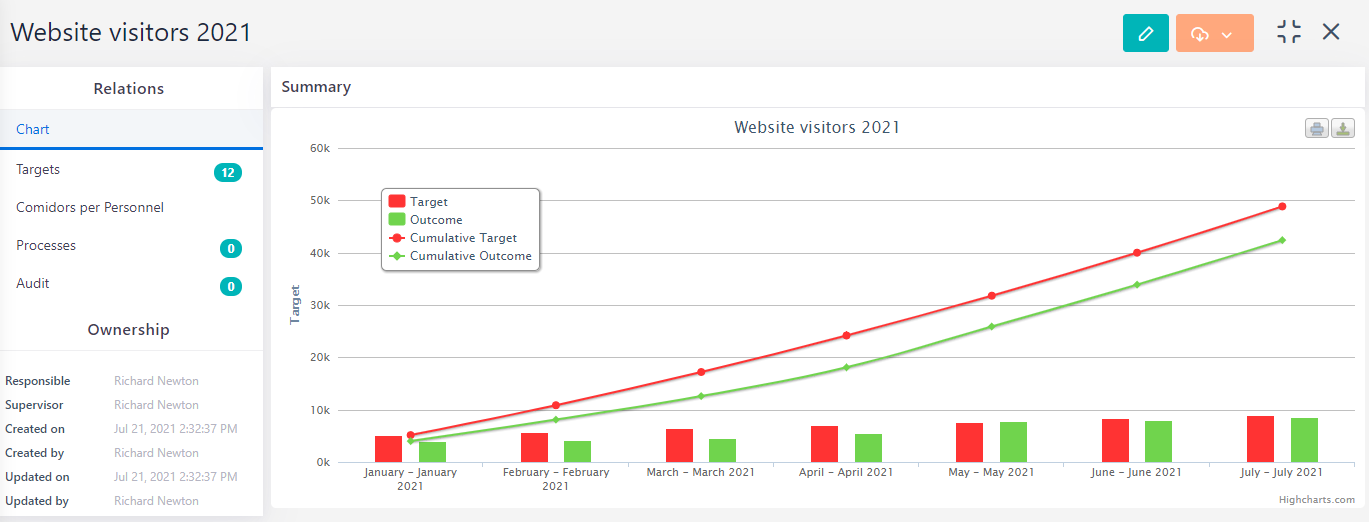
- Navigate to the chart to view how Targets are improved within the Time frame. Download the graph or Print it
- Click on Targets to check to view progress and results
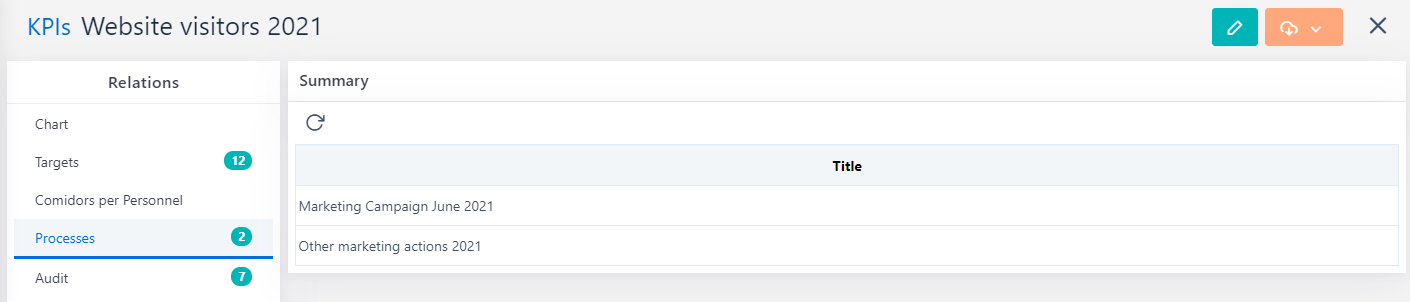
- Click the Processes tab to view all Processes that are using this KPI/Objective
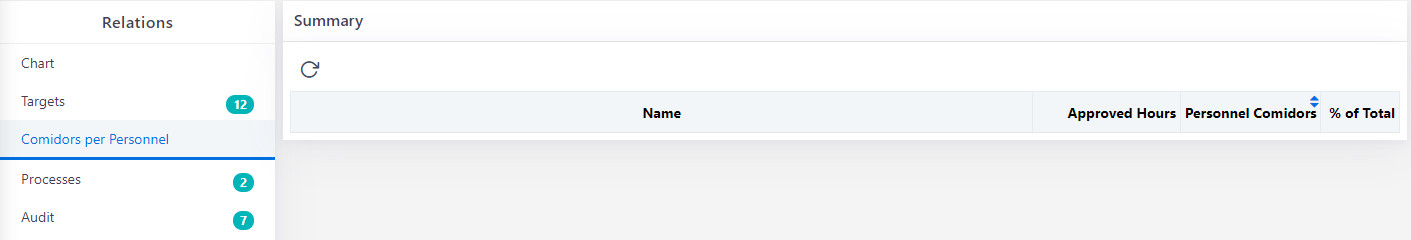
- Click on Comidor per Personnel to view the amount of “Comidors” reached per Personnel
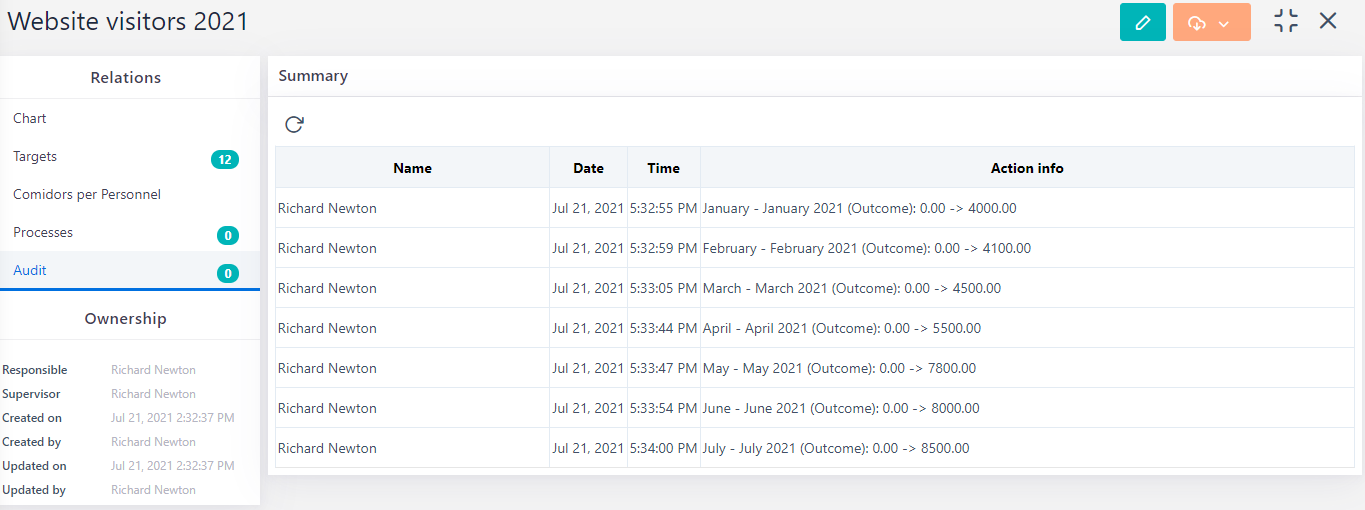
- On the Audit tab, you can see all the changes performed on the KPI targets
- Click on the Actions Icon to delete, print, and view the KPI report
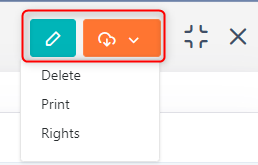
- Click on the Pencil Icon to edit the KPI
- Edit the KPI access rights and add tags to the KPI
KPIs can be monitored from the Home Dashboard by adding a Graph.
- Firstly, go to unit Widgets, create a new one, and in Type choose KPIs. Then select the KPI you would like to be displayed in your widget.
- Then, go to your Home Dashboard and click on the edit your dashboard button. Drag-n-drop a Graph tile. The Graph tile populates all Widgets, so choose the KPI widget you have just created.
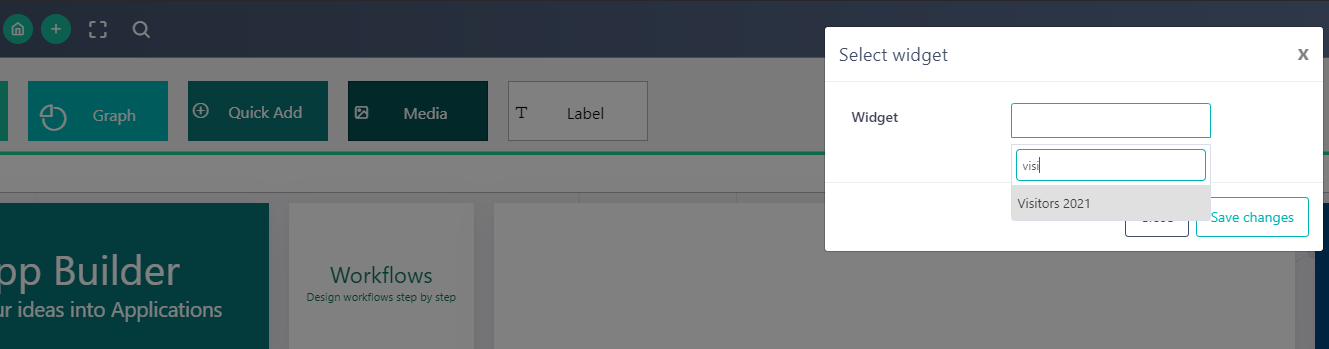
Learn more info about Widgets and Home Dashboard options.