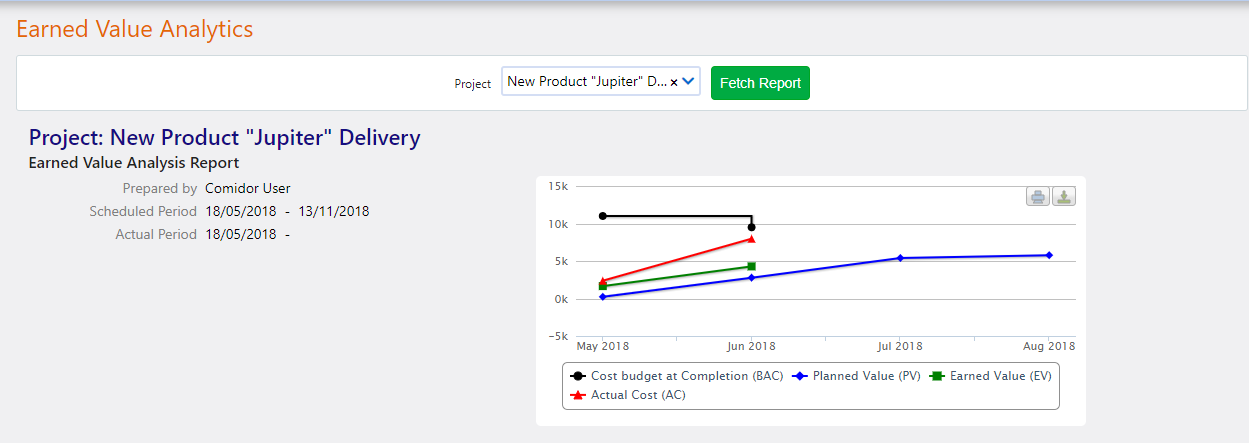
Earned Value Analytics will help you get the cost performance of a Project based on actual accomplishments, as it is difficult to evaluate Project financials using only traditional Project Management methods.
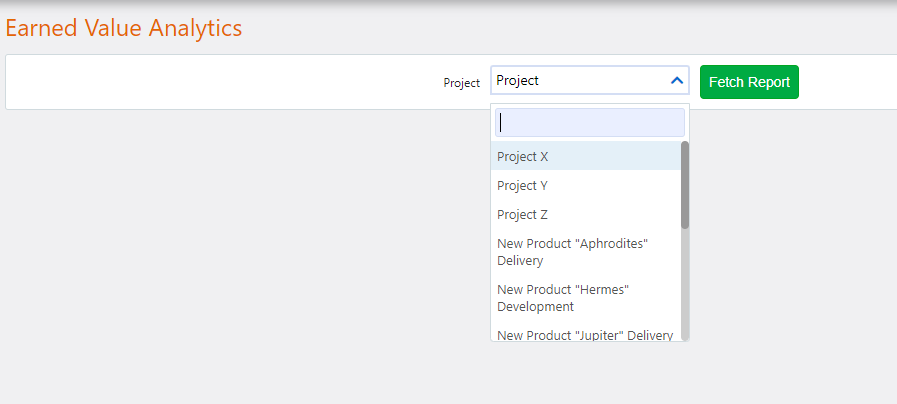
- Go to Business Apps Icon > Project Management> Projects and then select from the Actions button the Earned Value Analytics option. Alternatively, go to Business Apps Icon > Project Management> Earned Value Analytics, or Reports and Analytics Icon > Project Management > Earned Value Analytics.
- Select the project you wish from the list and click on Fetch Report.
- Get informed with the visualized representation of metrics:
- Cost budget at Completion (BAC): the budget cost that the Project Manager can track through Progress Management. This can alter based on the cost that is expected to be spent on this project from the project manager perspective.
- Planned Value (PV): Alternatively, this can be named as Budgeted Cost of Work Scheduled (BCWS). In planned value, you will have all the Budget Expenses of the Project, again tracked in a monthly mode.
- Earned Value (EV): Earned Value is the amount of money earned from completed work in a given time. It is also calculated based on the % of Project Completion and BAC that is set in Set Progress of a Project feature by Project Manager. Alternatively, you may name it Budgeted Cost of Work Performed (BCWP).
- Actual Cost (AC): Also known as Actual Cost of Work Performed (ACWP) is the actual amount of money spent and is placed in the actual and approved Expenses of the Project.
- Get informed of the metrics amount of money by hovering your mouse above the graph.
- Click on one of the graph headers to activate or deactivate them in the graph.
- Print or download the graph by pressing the related button.
Tables Tab
Navigate to the Tables tab to see the Project Performance Metrics based on the basic elements were explained above:
- Planned Value (PV) or Budgeted Cost of Work Scheduled (BCWS): Get informed on the Total Budgeted Cost in all Work-Packages, but also with the Cumulative Planned Value (PV) per Work-Package in monthly mode.
- Actual Cost and Earned Value: Check the Cumulative Actual Cost (AC) for the Project on a monthly basis (actual Expenses) and the Cumulative Earned Value (EV) of the Project on a monthly basis (amount of money earned from completed work in a given time, which is calculated based on the % of Project Completion and BAC that is set by Project Manager.
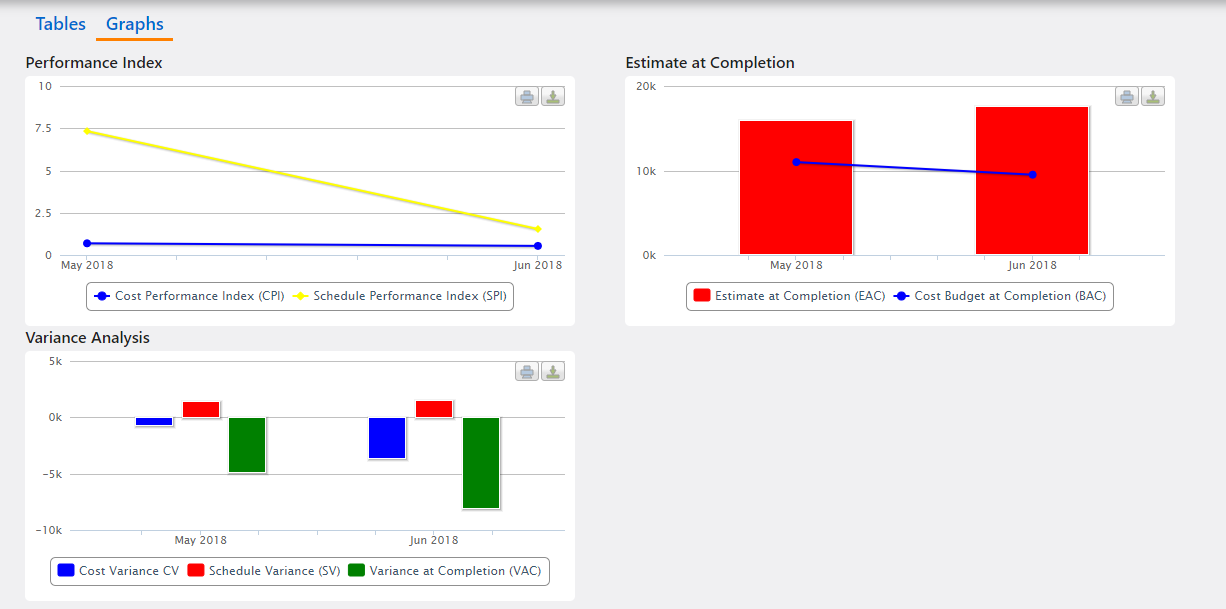
- Project Performance Metrics: Get informed on metrics such as the Cost Variance (CV), which is actually the difference between the EV and AC on a monthly basis. Also, take information on the Schedule Variance (SV), which is the difference between EV and PV on a monthly basis. Cost Performance Index (CPI) is the ratio between EV and AC, which shows whether or not Project Manager has the expected Progress in the Project Work when compared with the actual Expenses. Finally, the Schedule Performance Index (SPI) is the ratio between EV and PV, which shows whether or not Project Manager has the expected Progress in the Project Work when compared with the budget Expenses he has planned. Positive results are shown in green and negative ones in red. All results are provided in a monthly mode. CPI that is greater than 1 means that you are earning more than the amount spent; you are under budget. CPI that is less than 1 means that you are earning less than the amount spent, so you are under budget. CPI equal to one means that earning and spending are equal. SPI that is greater than 1, means that more work has been completed than the planned one and you are ahead of schedule. On the other hand, SPI that is less than 1, means that less work has been completed than the planned work; thus, you are behind schedule. If SPI equal to one, you are on time.
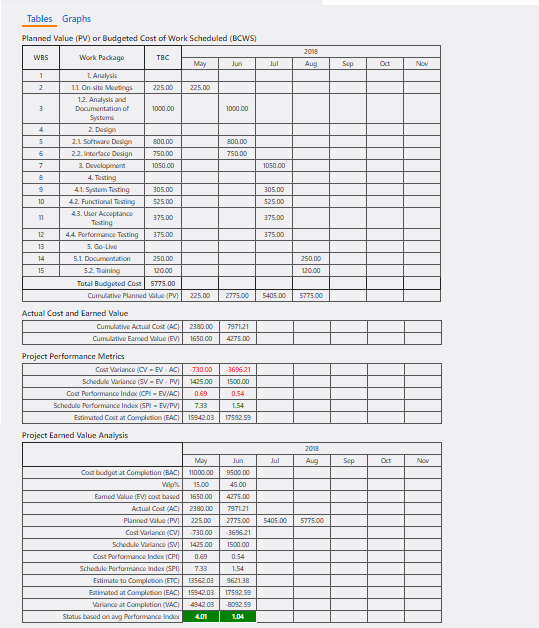
- Project Earned Value Analysis: In this table Project Manager(s) can get informed on all the above metrics, but also take forecasting information.
- Cost budget at Completion, WIP% and Earned Value (EV) cost-based: When cost that is expected to be spent for this project from the project manager perspective is multiplied by the current WIP% completion for this Project, we get the Earned Value (EV) cost based amount of money. These results are provided in a monthly mode and are added by Project Manager in Progress Management.
- Actual Cost (AC): The actual amount of money spent and is placed in the actual and approved Expenses of the Project in a monthly mode.
- Planned Value (PV): In planned value, you will have all the Budget Expenses of the Project, again tracked in a monthly mode.
- Cost Variance (CV): The difference between the EV and AC on a monthly basis.
- Schedule Variance (SV): The difference between EV and PV on a monthly basis.
- Cost Performance Index (CPI): The ratio between EV and AC, which shows whether or not Project Manager has the expected Progress in the Project Work when compared with the actual Expenses. CPI that is greater than 1 means that you are earning more than the amount spent; you are under budget. CPI that is less than 1 means that you are earning less than the amount spent, so you are under budget. CPI equal to one means that earning and spending are equal.
- Schedule Performance Index (SPI): The ratio between EV and PV, which shows whether or not Project Manager has the expected Progress in the Project Work when compared with the budget Expenses he has planned. SPI that is greater than 1, means that more work has been completed than the planned one and you are ahead of schedule. On the other hand, SPI that is less than 1, means that less work has been completed than the planned work; thus, you are behind schedule. If SPI equal to one, you are on time.
- Estimate to Completion (ETC): The expected amount of money that will be spent to complete the remaining part of the Project. This can be calculated from the difference between the Estimated at Completion (EAC) and Actual Cost (AC).
- Estimated at Completion (EAC): This indicates the total estimated cost of the Project, which is calculated based on the ratio of the budget cost that Project Manager adds through Progress Management feature (BAC) and the Cost Performance Index (CPI).
- Variance at Completion (VAC): This gives you an indication of how much you are under budget or over budget when the Project completes. This is the difference between the Budget at Completion (BAC) and Estimate at Completion (EAC). Positive variance means that the Project is under budget and negative variance means that the Project is over budget.
- Status based on avg Performance Index: This is the sum of CPI and SPI divided by 2, which actually gives an indicative number. If the number is less than 0.65 will be highlighted in black, a number from 0.65 to 0.85 is highlighted in red, a number from 0.85 to 1 is highlighted in yellow and number greater than 1 is highlighted in green.
Graphs Tab
Navigate to the Graphs tab to see the Project Performance graphs:
- View the Performance Index metrics (CPI and SPI), the Estimate and Cost Budget at Completion (EAC and BAC) and Variance Analysis (CV, SV, VAC).
- Hover the mouse above graphs to get instant numbers.
- Click on one of the graph headers to activate or deactivate them in the graph.
- Download or Print graphs