Gantt chart definition
A Gantt chart is a type of bar chart that illustrates a project schedule in terms of project activities against time. It was first introduced in the 1910’s by Henry Gantt in his effort to visualize project management timelines, and is now the most popular tool among traditional and modern project management methods worldwide.
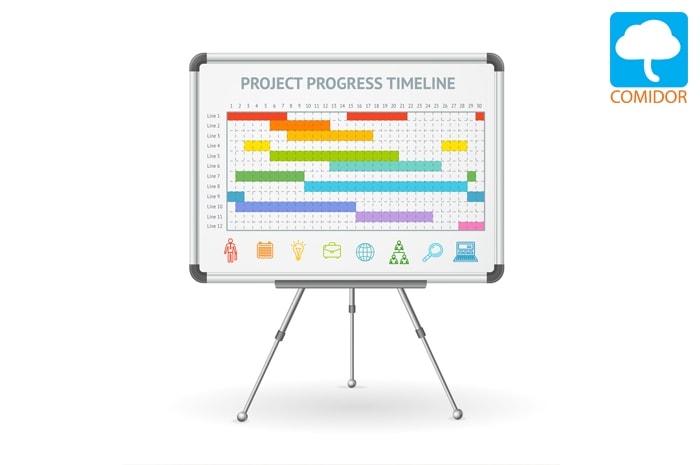
It is easy to understand the structure of a Gantt chart: it consists mostly of bars and connections between them. The bars represent the start and finish dates of tasks while the connections represent dependencies among them (for example a task has to be completed before the execution of the next task begins).
Gantt charts in Project Management
On a previous article, we discussed about how you can Empower Project Management with Gantt Charts. The reason why Gantt charts are so extensively used in project management is that they visualize the entire project information (project start and finish dates, task execution status -completed, running or overdue-, project priorities and personnel availability in each phase of the project) in one view.
Having all this information in one single view can help managers better schedule their time and deliver remarkable results. This way they can easily avoid missing a deadline or executing a task out of sequence.
How to create a Gantt chart
The process of creating a Gantt chart consist of the planning and visualization sub processes.
Planning
During the planning sub process, you have to list all the project tasks that must be completed and the important milestones. Determine the expected start and end date of each task and whether there are any dependencies between them. Another thing you should take under consideration is the resource planning. Make sure to assign tasks in a way that work packages will not overlap for involved team members and that scheduling will be flexible to change in the future without affecting the execution and outcomes.
Visualization
There are many ways to visualize a Gantt chart but the most popular so far are using excel sheets or online software tools.
1. Using excel
Excel cells and bar charts have been used to represent tasks for years. This method is more traditional and it offers limited functionality but it has a lot of adopters because of the simplicity of the planning process. In case you decide to follow this method for your project, collect the tasks along with their scheduled start & end time in an excel document and use this data to produce a graph with bars. You can find many useful resources on the internet, like step-by-step video tutorials and excel product guides suggesting different ways in which you can use excel sheets for your task data visualization,. If you are seeking for something more than just a simple visualization, then you will have to go with the second method as described below.
2. Using an online Software solution
Online software tools are designed and implemented especially for project managers. In this case, Gantt charts are mostly connected to project entities that include a lot more information than just scheduled start and end dates. These entities are usually connected to tasks, processes, accounts, requirements, deliverables and any relevant information that may be useful during the execution. Bars and dependencies can be added with drag and drop functionality while smart notifications keep the team updated about changes, deadlines and progress. Identifying the best pm software may take a lot of time and effort since every company has its own needs, but Capterra listing of the best project management tools or Quora user forums may make the evaluation process easier for you.
Excel in the use of Gantt Charts
A Gantt chart can help you strengthen your project management skills, come up with patterns that will make your job easier and identify weaknesses that will be used to change the strategic planning of your projects. Your needs are also something that will potentially change multiple times as your business grows and expands its activity. Having this in mind, is the key to excel in the use of Gantt charts. Your final decision on which software to choose must depend on the needs of your future company, not your current.
How to choose your Gantt chart maker
We have discussed in a previous post about the 27 + 1 features a project management software should include. To choose the best software, make a list of requirements and apply demanding use cases on tools to check their performance.
Flexibility and collaboration will help you make the difference. An experienced project manager may find a million ways to use a software by applying different pm methodologies and execution patterns. The pm tool must be able to support experimenting and be open to further customization.
Comidor online Gantt chart
Comidor Project Management is used by companies in the project management industry all over the world. The reason they choose Comidor to manage multinational projects is that it can be applied to all business departments connecting projects with documents, operations and people. Comidor is flexible, easy to use and can be fully customized. Templates are used in combination with workflows to automate repetitive procedures and improve productivity.
A pm tool is used by project managers of all business departments. No advanced IT skills are needed to get familiar with Comidor user interface and roles protect sensitive information from being viewed by everyone.
Check out Comidor Project Management Features: